Gut microbiome and the Shannon Index
As someone who has increasingly paid more attention to health, I came across a very interesting talk on gut microbiome by Dr. Been and Dr. Hazan:
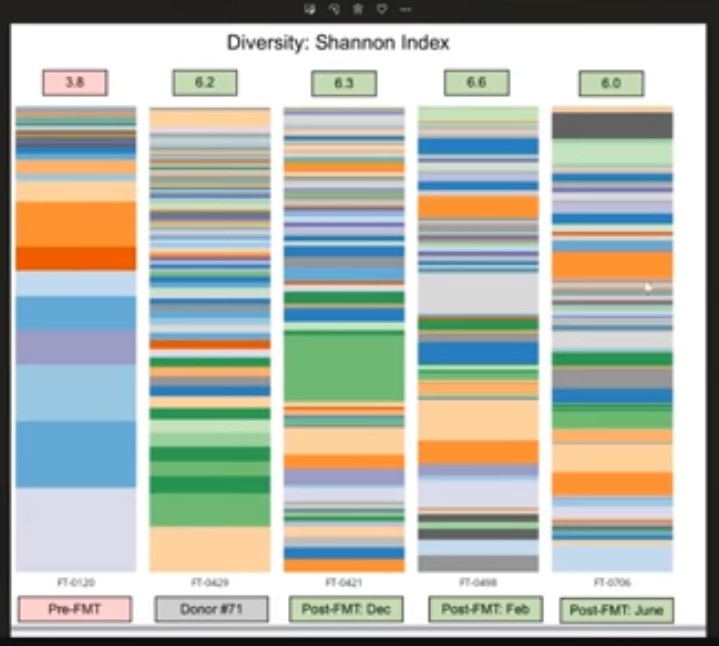
Some very interesting information and cutting-edge research being done by Dr. Hazan on gut microbiome and how it could have a causal link to many troublesome diseases, including baldness, Parkinsons, autism, and even Covid-19! In particular, Dr. Hazan explains how the gut microbiome diversity changed drastically after treatment with the following graphic:

Basically, after treatment, the symptoms lessened dramatically and correlated with the increase of gut microbiome diversity in the patient (compare the leftmost band to the 3 bands on the right, with more bands = more bacteria species).
Here they use the ‘Shannon Index’ as a measure of diversity. But what is the Shannon Index?
The Shannon-Wiener Index
\[H' = -\sum_{i=1}^R p_i \ln(p_i) = \ln(\frac{1}{\sum_{i=1}^R p_i^{p_i}})\]where \(p_i\) is often the proportion of individuals belonging to the ith species in the dataset of interest. In other words, \(p_i = n/N\), where n is the number of instances a particular species and N is the total number of individuals.
Thus, with only 1 species present, the denominator will be 1 and the natural log of 1 will give you 0 for the index, i.e. no diversity at all. Whereas, if you have many species present in similar proportions, the denominator term will be minimized, leading to a larger Shannon Index.
Information Gain
Coincidentally, Machine Learning also uses the Shannon Index! It is used in Decision Trees to decide what features to split the data on first, with the first split being done on features that give you the best “information gain”. But what is information gain?

Without boring you with the details, let’s look at the main intuition behind the Decision Tree process:
- The Decision Tree wants to split the data on features that gives you the most ‘information gain’
- Information gain can be calculated using the Shannon Index, which can show you how ‘diverse’ the data becomes after each split
- By choosing splits that decrease the data diversity the most (i.e. gives you the most ‘pure’ groups), information gain is maximized
For more information, please check out the Wikipedia page. But don’t forget to also take care of your gut!
